运行监控
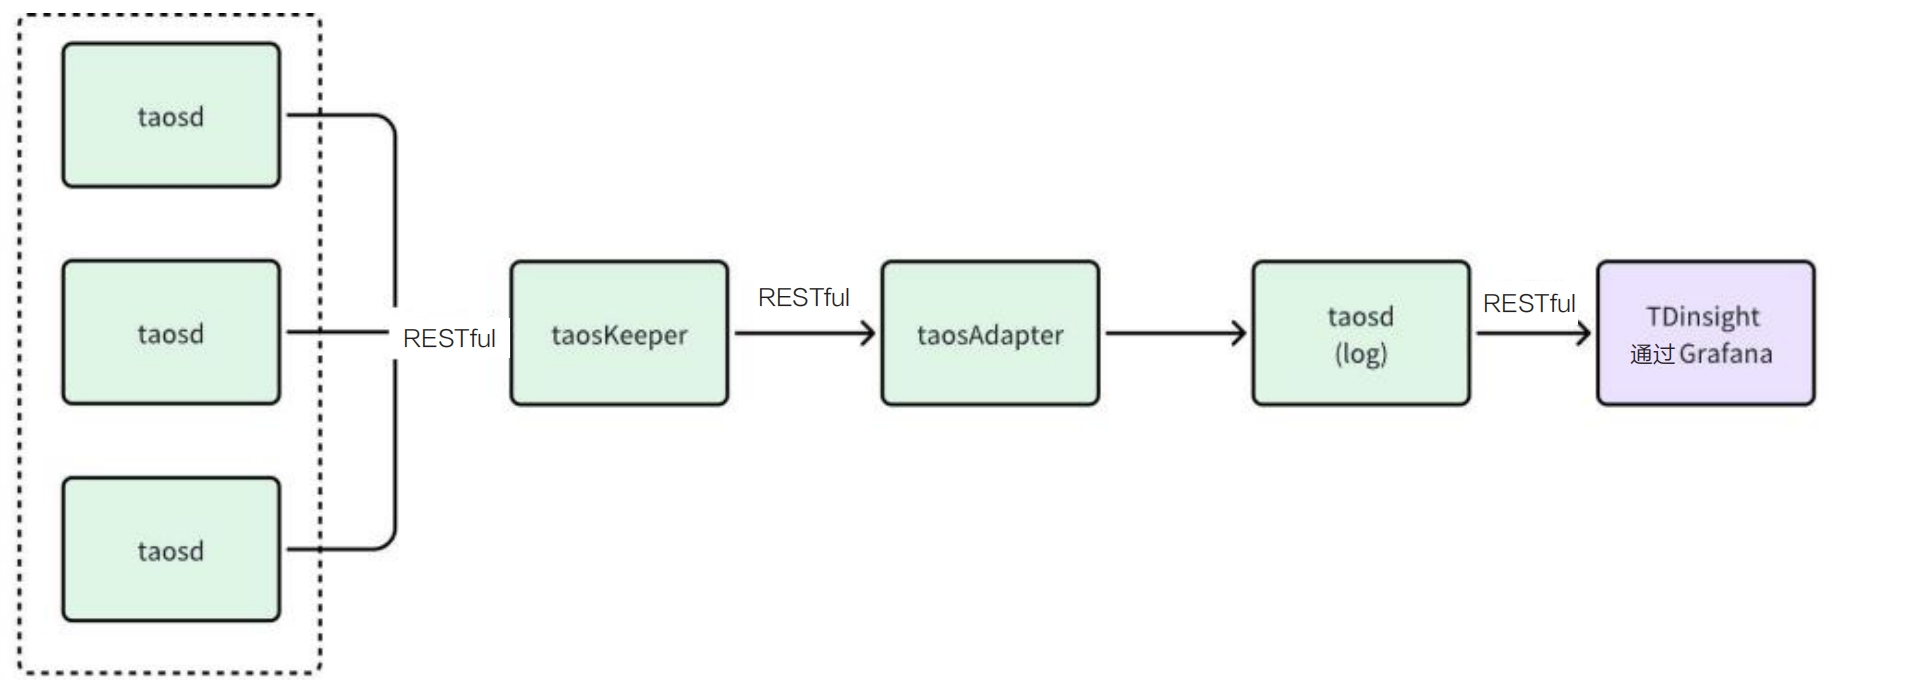
为了确保集群稳定运行,TDengine TSDB 集成了多种监控指标收集机制,并通过 taosKeeper 进行汇总。taosKeeper 负责接收这些数据,并将其写入一个独立的 TDengine TSDB 实例中,该实例可以与被监控的 TDengine TSDB 集群保持独立。TDengine TSDB 中的两个核心组件 taosd(数据库引擎)和 taosX(数据接入平台)都通过相同的监控架构来实现对其运行时的监控,但各自的监控指标设计有所不同。
至于如何获取和使用这些监控数据,用户可以使用第三方的监测工具比如 Zabbix 来获取这些保存的系统监测数据,进而将 TDengine TSDB 的运行状况无缝集成到现有的 IT 监控系统中。也可以使用 TDengine TSDB 提供的 TDinsight 插件,使用该插件用户可以通过 Grafana 平台直观地展示和管理这些监控信息,如下图所示。这为用户提供了灵活的监控选项,以满足不同场景下的运维需求。
配置 taosKeeper
因为 TDengine TSDB 的监控数据都通过 taosKeeper 上报并存储,所以本节先介绍 taosKeeper 的配置。
taosKeeper 的配置文件默认位于 /etc/taos/taoskeeper.toml。详细配置见 参考手册。其中最为关键的一个配置项是 database,它决定了收集到的监控数据存储在目标系统的哪个数据库中。
监控 taosd
基于 TDinsight 监控 taosd
为了简化用户在 TDengine TSDB 监控方面的配置工作,TDengine TSDB 提供了一个名为 TDinsight 的 Grafana 插件。该插件与 taosKeeper 协同工作,能够实时监控 TDengine TSDB 的各项性能指标。
通过集成 Grafana 和 TDengine TSDB 数据源插件,TDinsight 能够读取 taosKeeper 收集的监控数据。这使得用户可以在 Grafana 平台上直观地查看 TDengine TSDB 集群的状态、节点信息、读写请求以及资源使用情况等关键指标,实现数据的可视化展示。
以下是 TDinsight 的详细使用说明,以帮助你充分利用这一强大工具。
前置条件
若要顺利使用 TDinsight,应满足如下条件。
- TDengine TSDB 已安装并正常运行。
- taosAdapter 已经安装并正常运行。
- taosKeeper 已经安装并正常运行。
- Grafana 已安装并正常运行,以下介绍以 Grafna 11.0.0 为例。
同时记录以下信息。
- taosAdapter 的 RESTful 接口地址,如
http://www.example.com:6041。 - TDengine TSDB 集群的认证信息,包括用户名及密码。
导入仪表盘
TDengine TSDB 数据源插件已提交至 Grafana 官网,如何安装 TDengine TSDB 数据源插件和配置数据源请参考 安装 Grafana Plugin 并配置数据源。完成插件的安装和数据源的创建后,可以进行 TDinsight 仪表盘的导入。
在 Grafana 的“Home” -> “Dashboards”页面,点击位于右上角的“New” -> “import”按钮,即可进入 Dashboard 的导入页面,它支持以下两种导入方式。
- Dashboard ID: 18180.
- Dashboard URL:
https://grafana.com/grafana/dashboards/18180-tdinsight-for-3-x/
填写以上 Dashboard ID 或 Dashboard URL 以后,点击“Load”按钮,按照向导操作,即可完成导入。导入成功后,Dashboards 列表页面会出现“TDinsight for 3.x”仪表盘,点击进入后,就可以看到 TDinsight 中已创建的各个指标的面板,如下图所示:
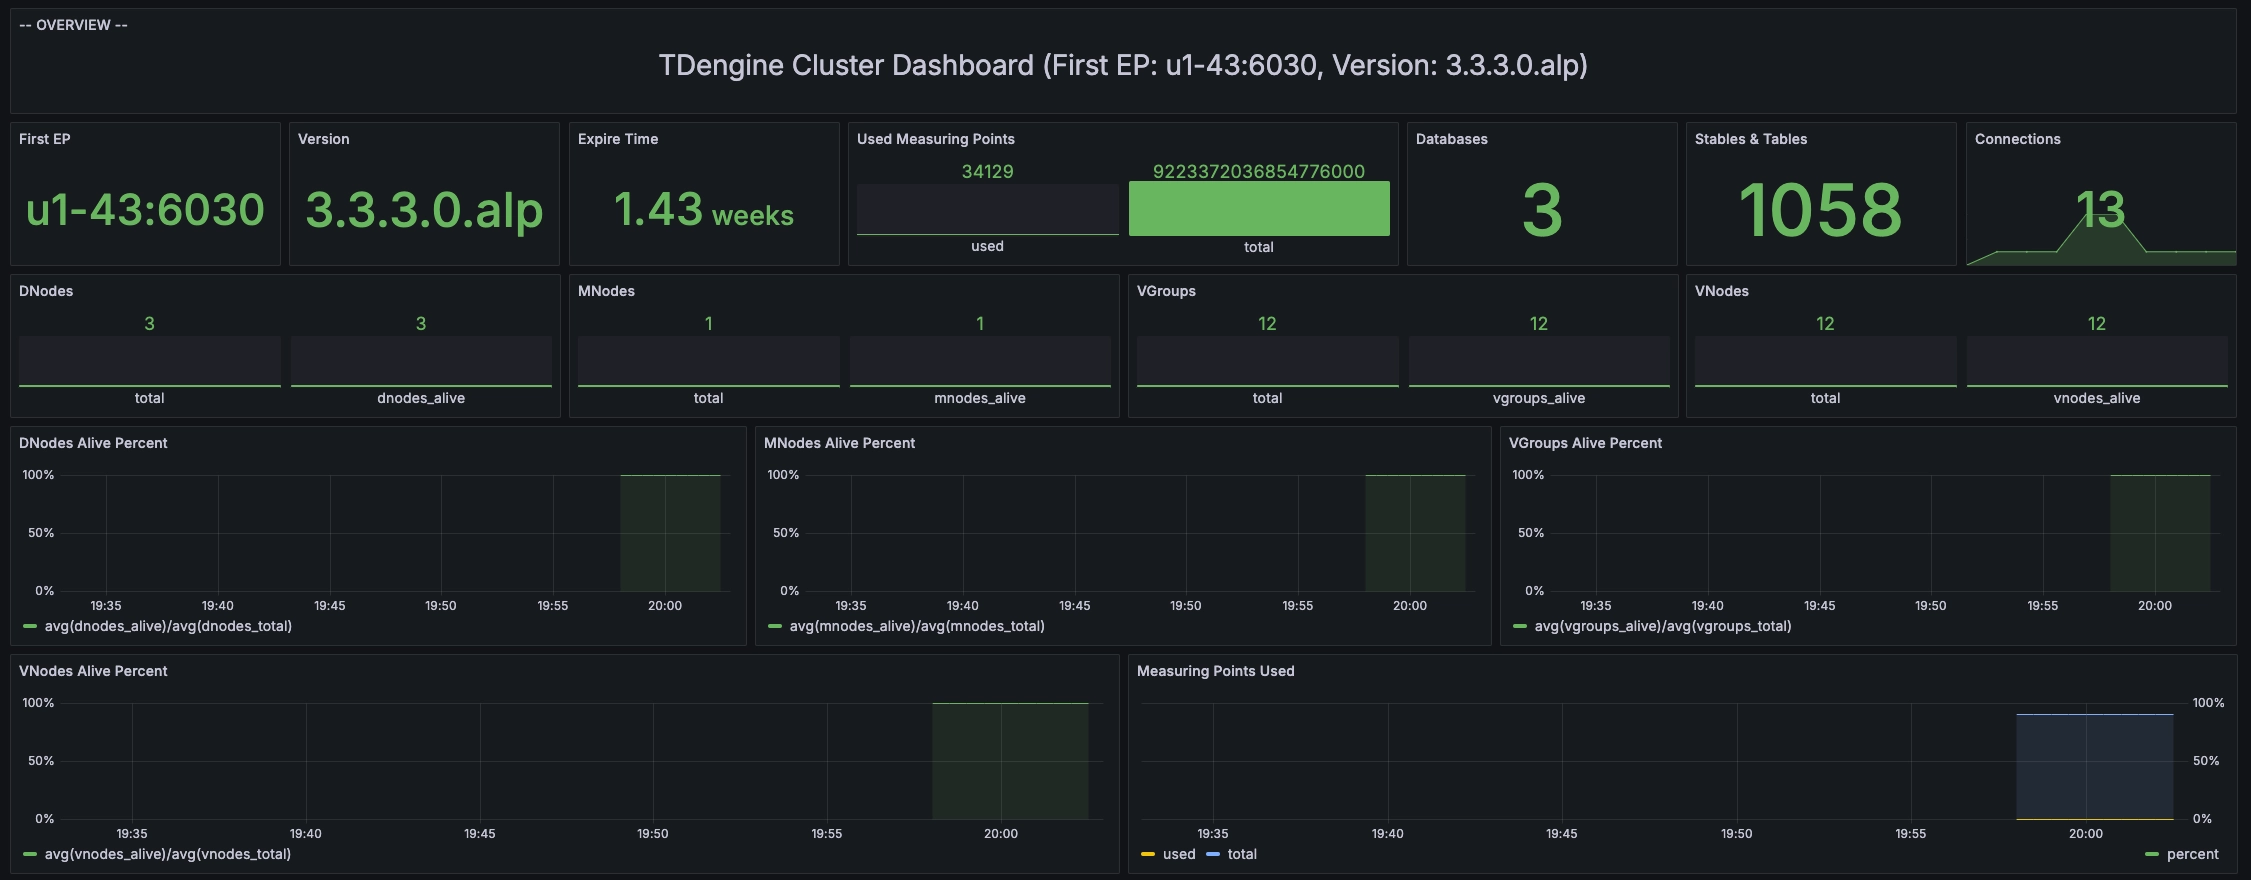
注意 在 TDinsight 界面左上角的“Log from”下拉列表中可以选择 log 数据库。
TDengine TSDB V3 监控数据
TDinsight dashboard 数据来源于 log 库(存放监控数据的默认数据库,可以在 taoskeeper 配置文件中修改)。“TDinsight for 3.x”仪表盘查询了 taosd 和 TaosAdapter 的监控指标。
- taosd 的监控指标请参考 taosd 监控指标
- taosAdapter 的监控指标请参考 taosAdapter 监控指标
监控 taosX
taosX 是 TDengine TSDB 中提供零代码数据接入能力的核心组件,对它的监控也十分重要。taosX 监控与 TDengine TSDB 监控类似,都是通过 taosKeeper 将服务搜集的 metrics 写入指定数据库,然后借助 Grafana 面板做可视化和报警。这个功能可监控的对象包括:
- taosX 进程
- 所有运行中的 taosx-agent 进程
- 运行在 taosX 端或 taosx-agent 端的各个连接器子进程
- 运行中的各类数据写入任务
前置条件
- taosd,taosAdapter 和 taosKeeper 都已经部署完成并启动成功。
- taosX 服务监控配置正确,如何配置可以参考下文“配置 taosX 监控”,服务启动成功。
注意:TDengine TSDB 企业版本 3.2.3.0 或以上版本包含的 taosX 才包含此功能。如果单独安装 taosX,需要 taosX 1.5.0 或以上版本。 - 部署 Grafana,安装 TDengine TSDB Datasource 插件,配置好数据源。可以参考:安装 Grafana Plugin 并配置数据源。
注意:需要安装 Grafana 插件 TDengie Datasource v3.5.0 或以上版本。
配置 taosX 监控
toasX 的配置文件 (默认 /etc/taos/taosx.toml) 中与 monitor 相关的配置如下:
[monitor]
# FQDN of taosKeeper service, no default value
# fqdn = "localhost"
# port of taosKeeper service, default 6043
# port = 6043
# how often to send metrics to taosKeeper, default every 10 seconds. Only value from 1 to 10 is valid.
# interval = 10
每个配置也有对应的命令行选项和环境变量。通过以下表格说明:
| 配置文件配置项 | 命令行选项 | 环境变量 | 含义 | 取值范围 | 默认值 |
|---|---|---|---|---|---|
| fqdn | --monitor-fqdn | MONITOR_FQDN | taosKeeper 服务的 FQDN | 无默认值,配置 fqdn 就等于开启了监控功能 | |
| port | --monitor-port | MONITOR_PORT | taosKeeper 服务的端口 | 6043 | |
| interval | --monitor-interval | MONITTOR_INTERVAL | taosX 发送 metrics 数据到 taosKeeper 的时间间隔,单位秒 | 1-10 | 10 |
基于 TDinsight 监控 tasoX
“TDinsight for taosX”是专门为 taosX 监控创建的 Grafana 面板。使用前需要先导入这个面板。
进入面板
-
在 Grafana 界面菜单中点击“Data sources”,然后选择已经配置好的 TDengine TSDB 数据源。
-
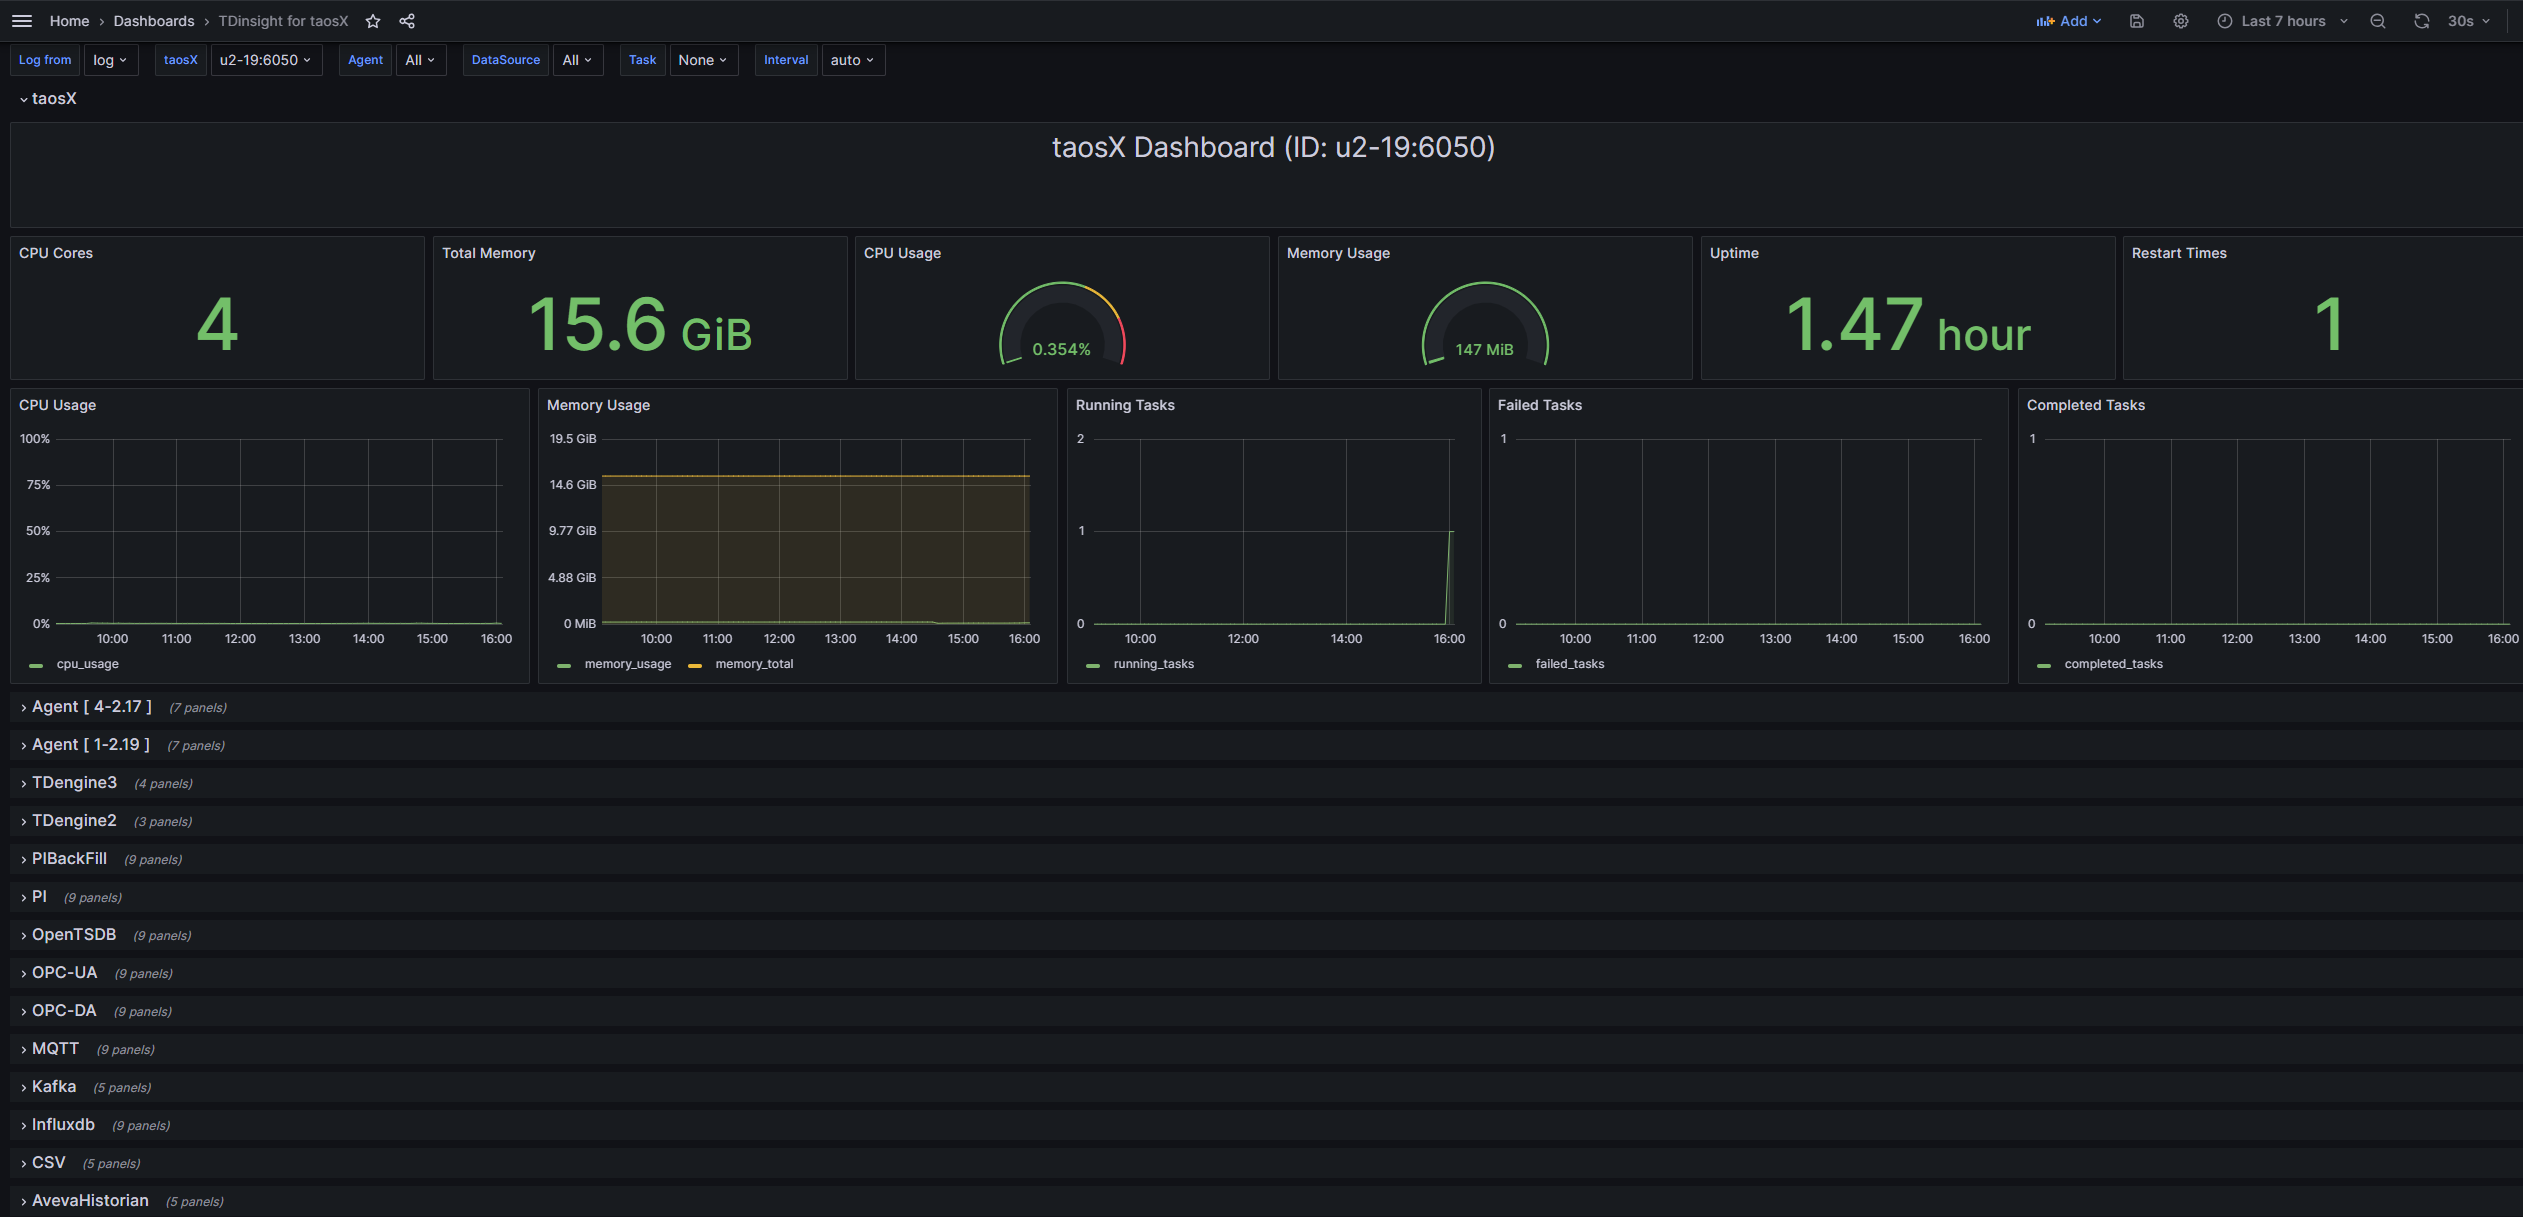
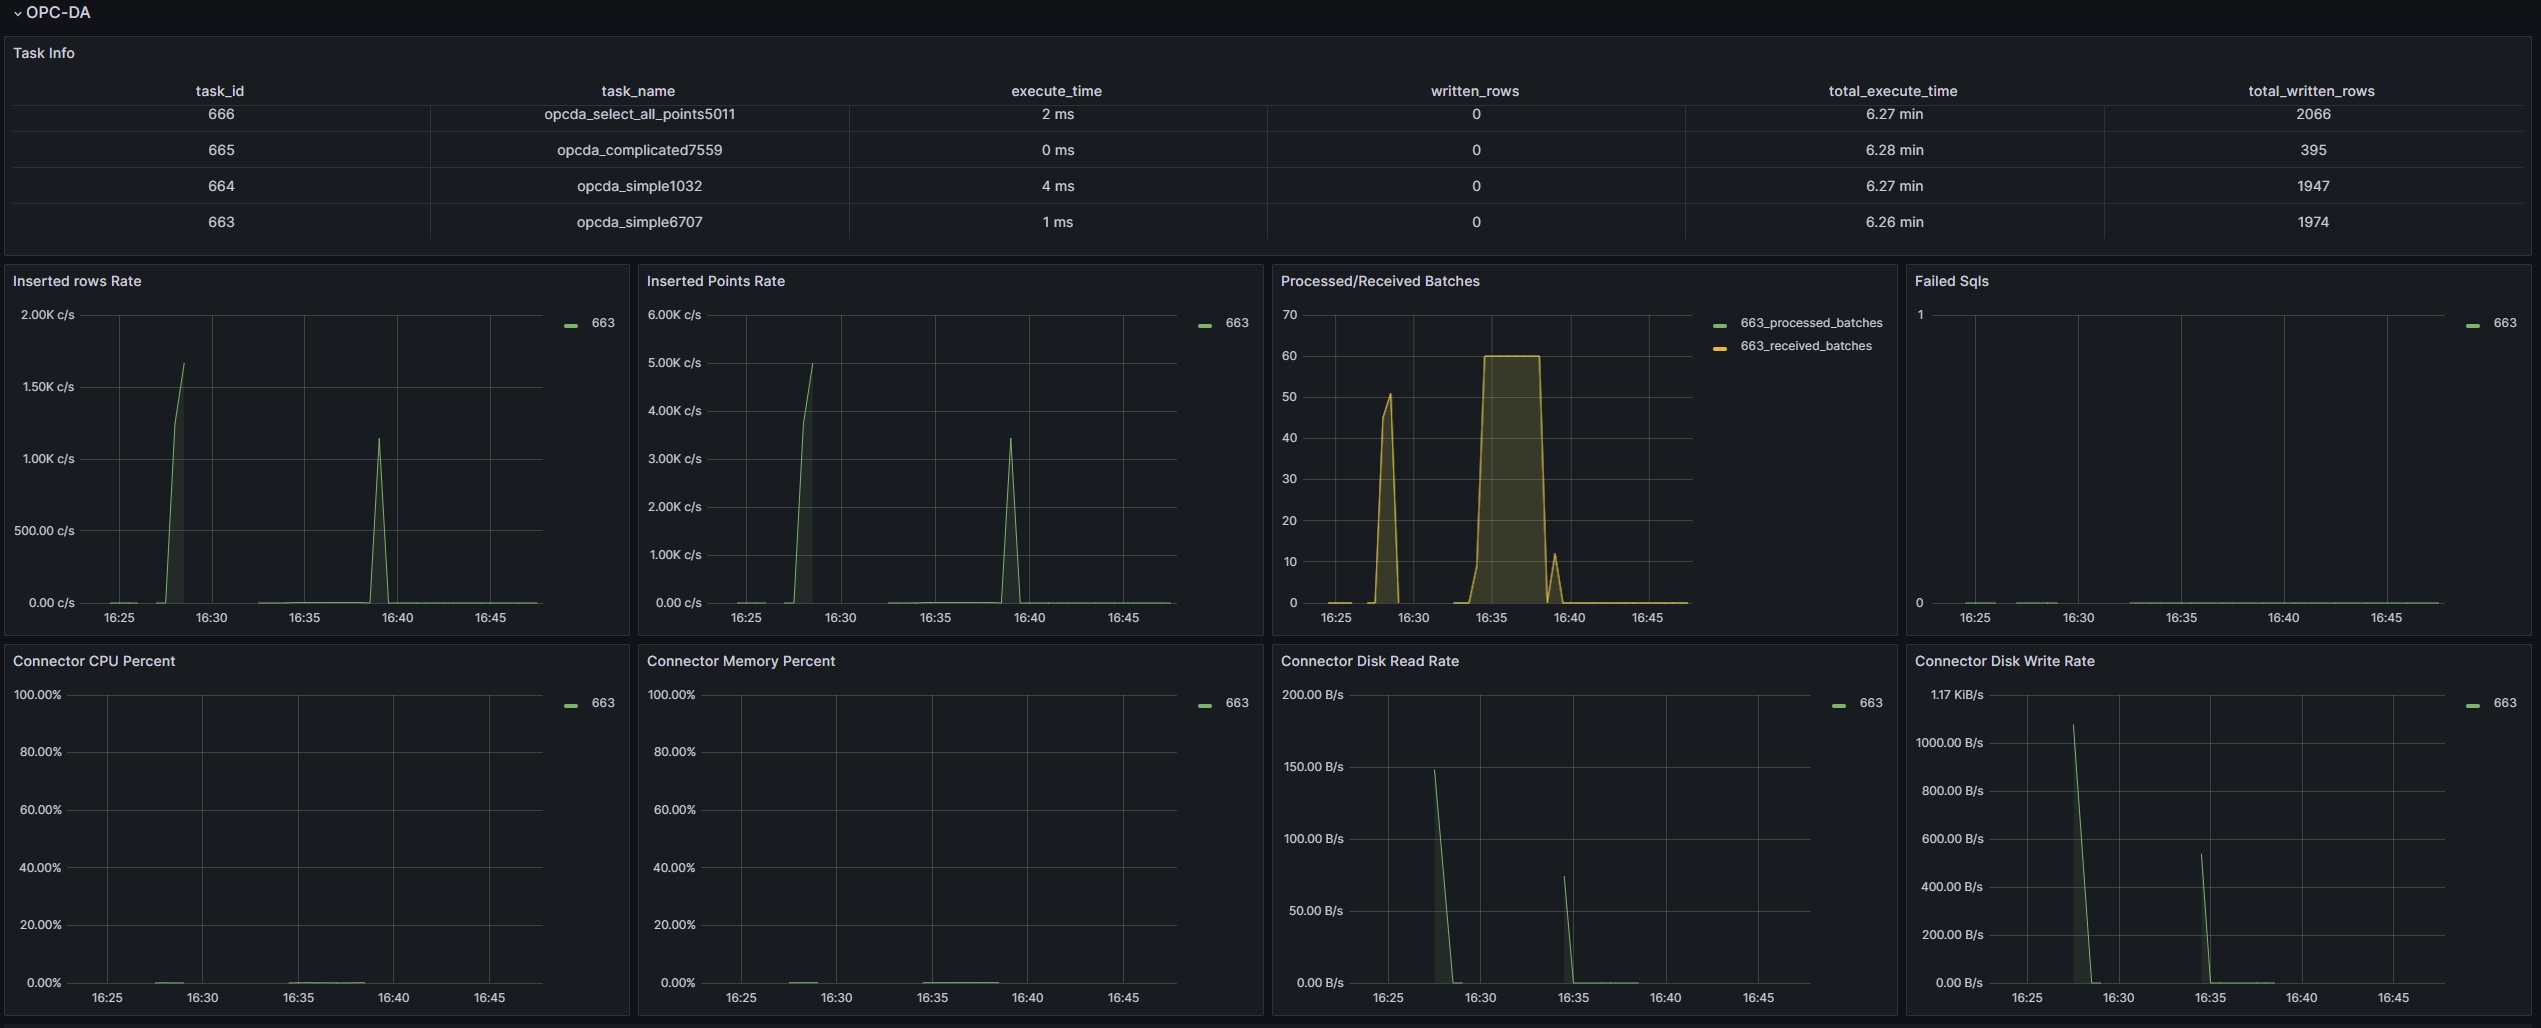
在数据源配置界面选择“Dashboard”Tab, 然后导入“TDinsight for taosX”面板(第一次使用需要先导入)。下面是一个示例图:
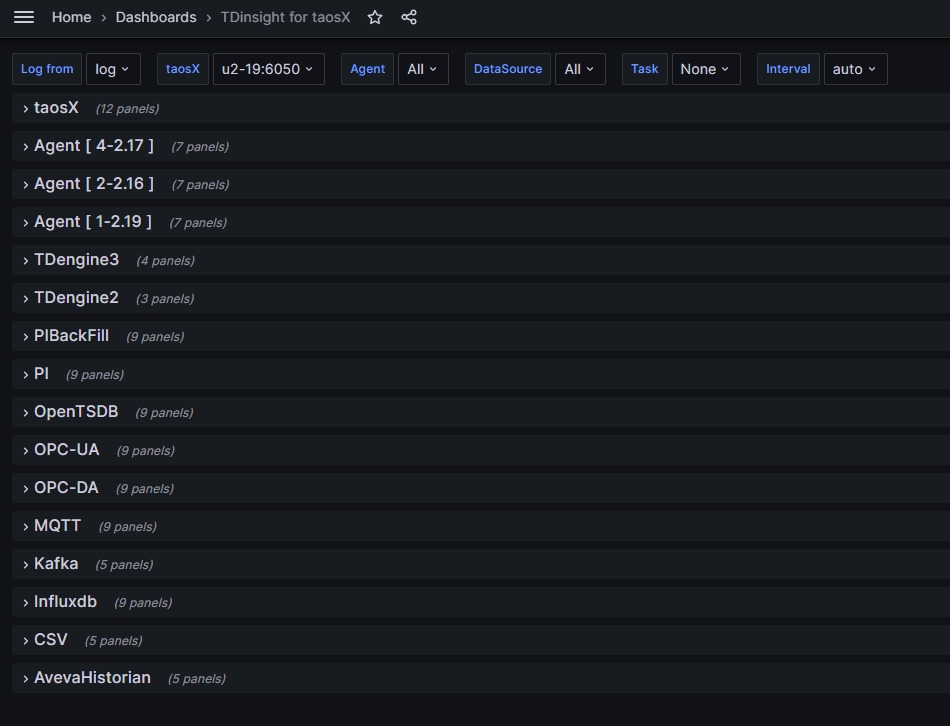
该面板每一行代表一个或一类监控对象。最上面是 taosX 监控行,然后是 Agent 监控行,最后是各类数据写入任务的监控。
备注- 如果打开这个面板后看不到任何数据,你很可能需要点击左上角的数据库列表(即“Log from”下拉菜单),切换到监控数据所在的数据库。
- 数据库包含多少个 Agent 的数据就会自动创建多少个 Agent 行。(如上图)
监控示例
-
taosX 监控示例图
-
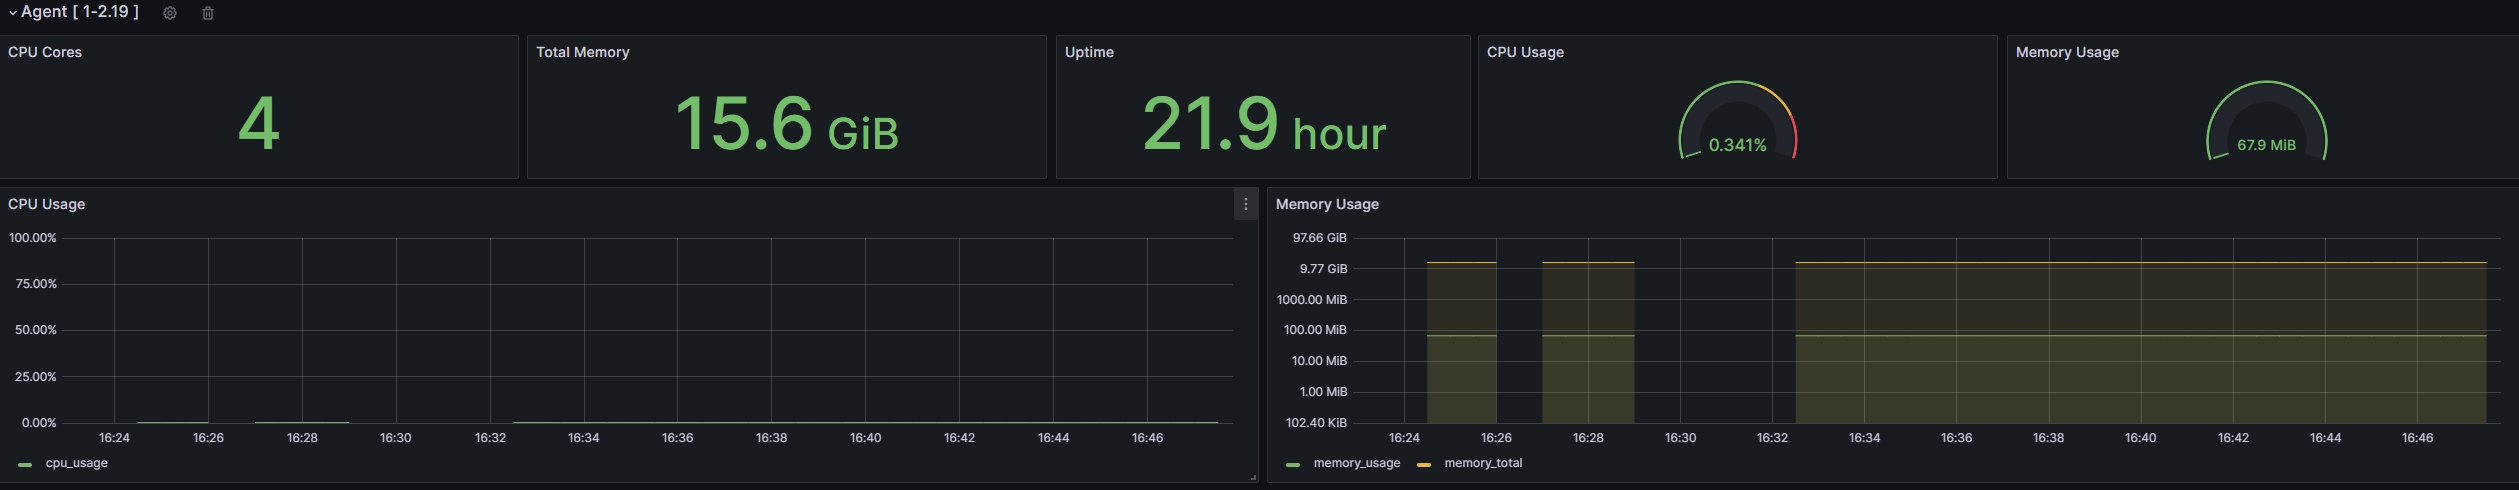
Agent 监控示例图
-
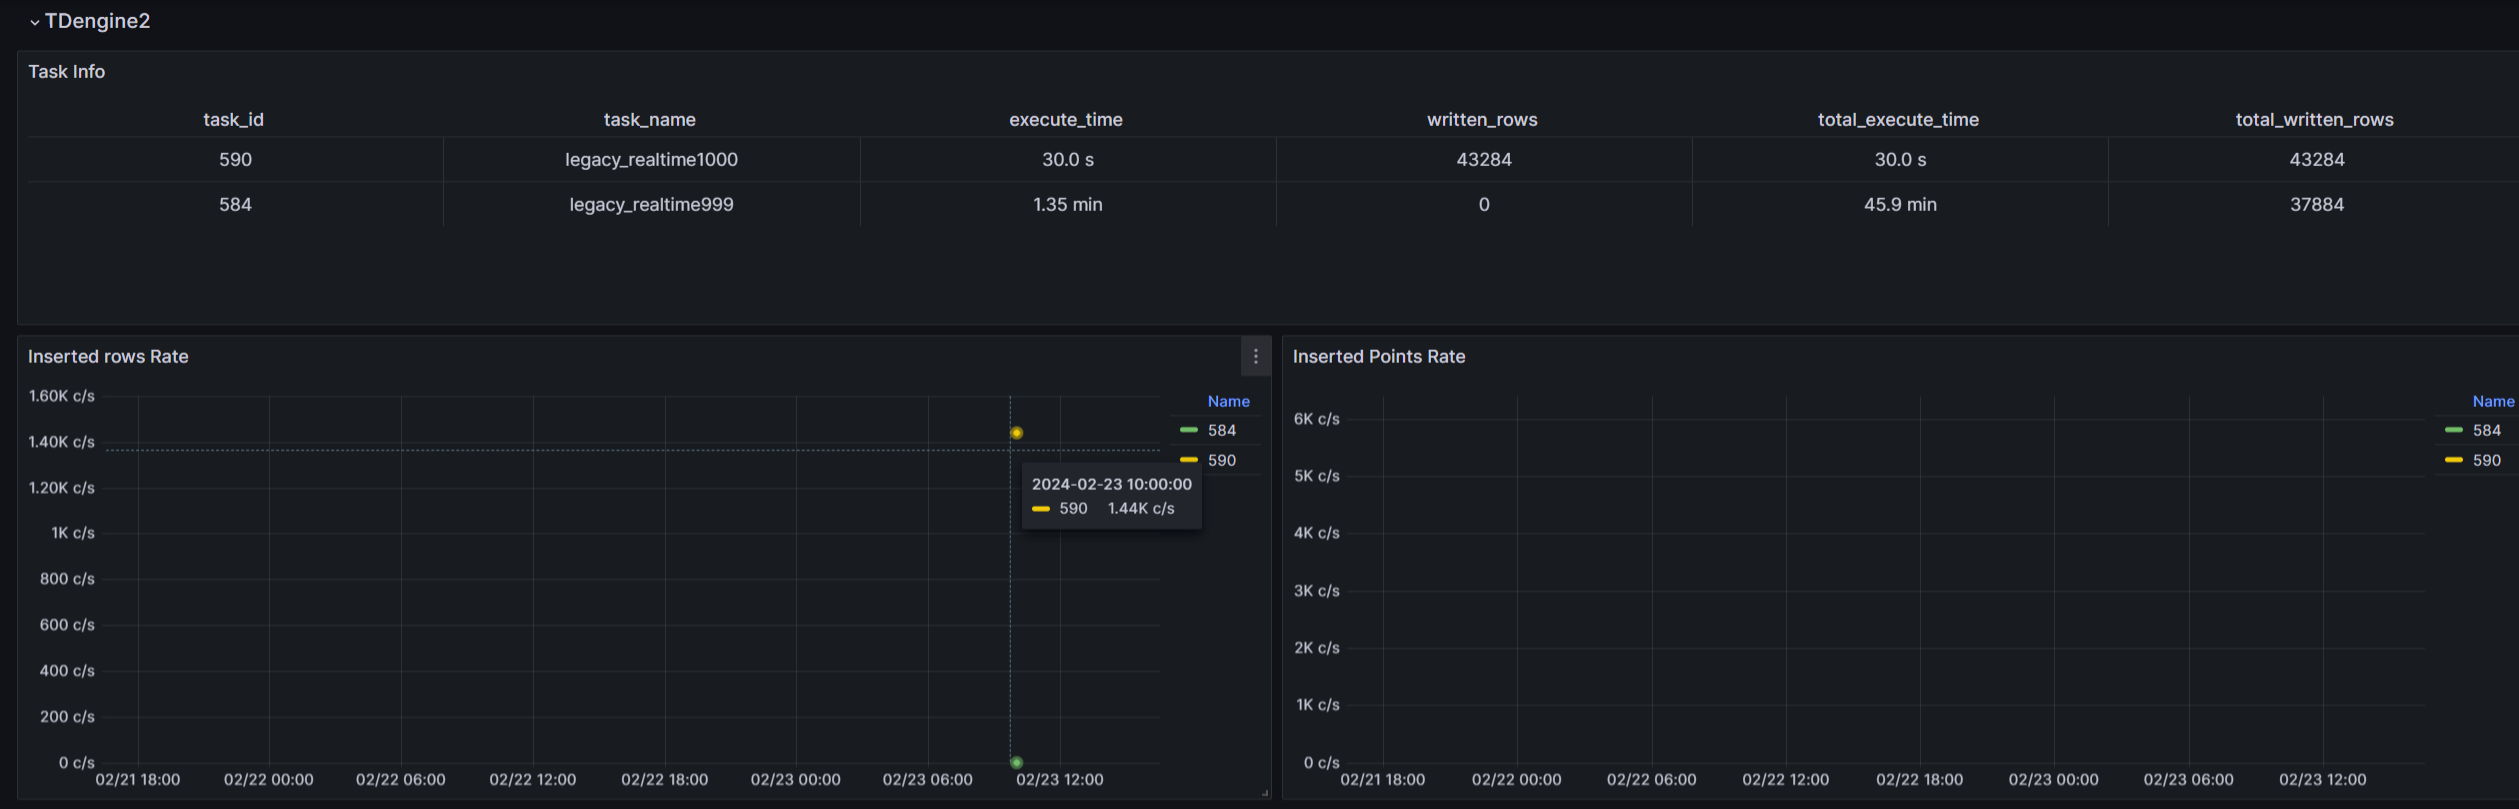
TDengine2 数据源监控示例图
 信息
信息监控面板只展示了数据写入任务的部分监控指标,在 Explorer 页面上有更全面的监控指标,且有每个指标的具体说明。
-
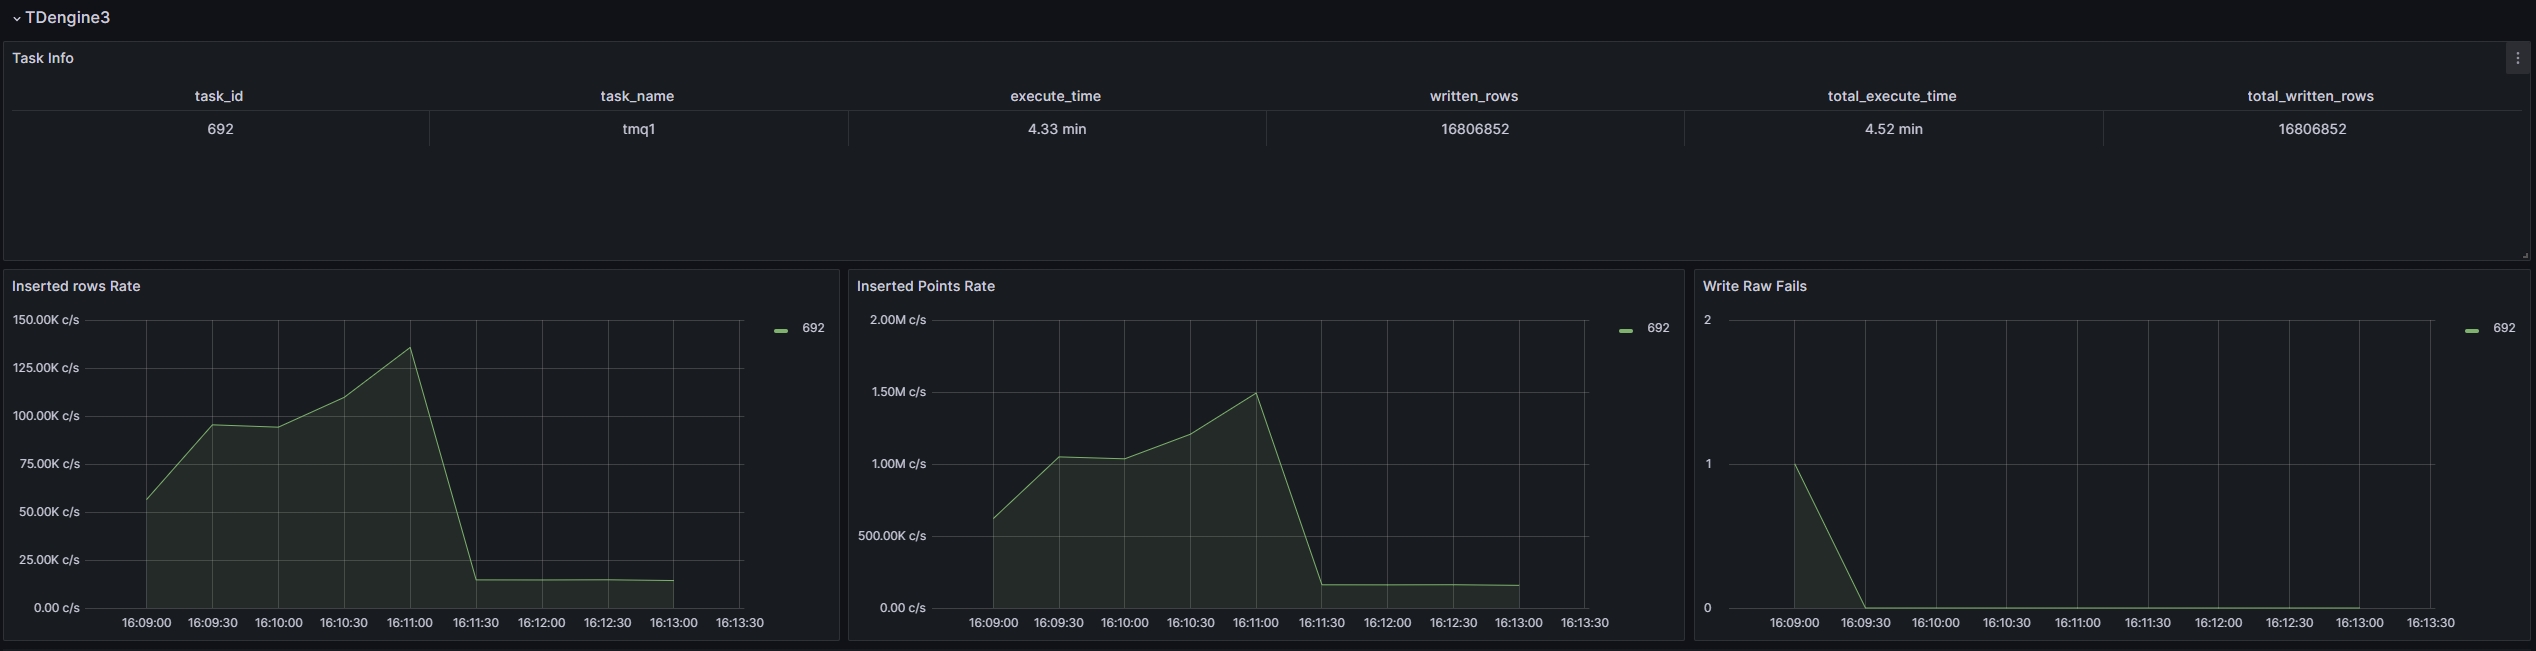
TDengine3 数据源监控示例图
-
其它数据源监控示例图
限制
只有在以 server 模式运行 taosX 时,与监控相关的配置才生效。
explorer 集成监控面板
explorer 支持集成已有的 grafana dashboard。
配置 grafana
编辑 grafana.ini, 修改以下配置项。配置 root_url, 可能对现有的 grafana 使用习惯有所影响,为了集成到 explorer 是需要如此配置的,方便通过 explorer 做服务代理。
[server]
# If you use reverse proxy and sub path specify full url (with sub path)
root_url = http://ip:3000/grafana
# Serve Grafana from subpath specified in `root_url` setting. By default it is set to `false` for compatibility reasons.
serve_from_sub_path = true

[security]
# set to true if you want to allow browsers to render Grafana in a <frame>, <iframe>, <embed> or <object>. default is false.
allow_embedding = true
配置 Explorer
修改 explorer.toml, 其中 dashboard 配置的 url 中的 ip, 应该配置为可以通过 explorer 服务器能够访问到的 grafana 服务的内网地址。
[grafana]
# The token of the Grafana server, which is used to access the Grafana server.
token = ""

# The URL of the Grafana dashboard, which is used to display the monitoring data of the TDengine TSDB cluster.
# You can configure multiple Grafana dashboards.
[grafana.dashboards]
TDengine3 = "http://ip:3000/d/000000001/tdengine3?theme=light&kiosk=tv"
taosX = "http://ip:3000/d/000000002/taosx?theme=light&kiosk=tv"
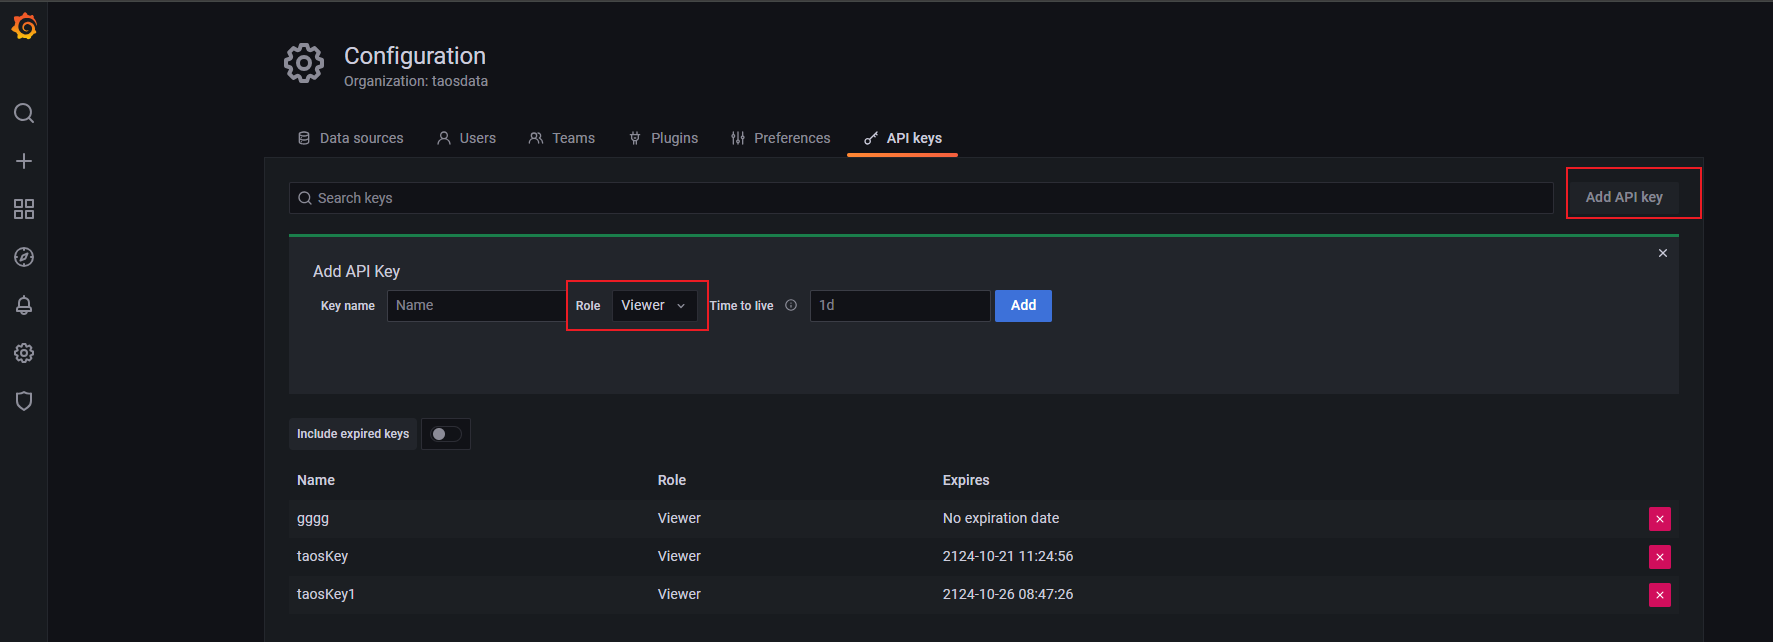
如下图 (grafana V-8.5.27),获取 api key, 请注意添加只读权限的 apikey, 否则有安全风险。
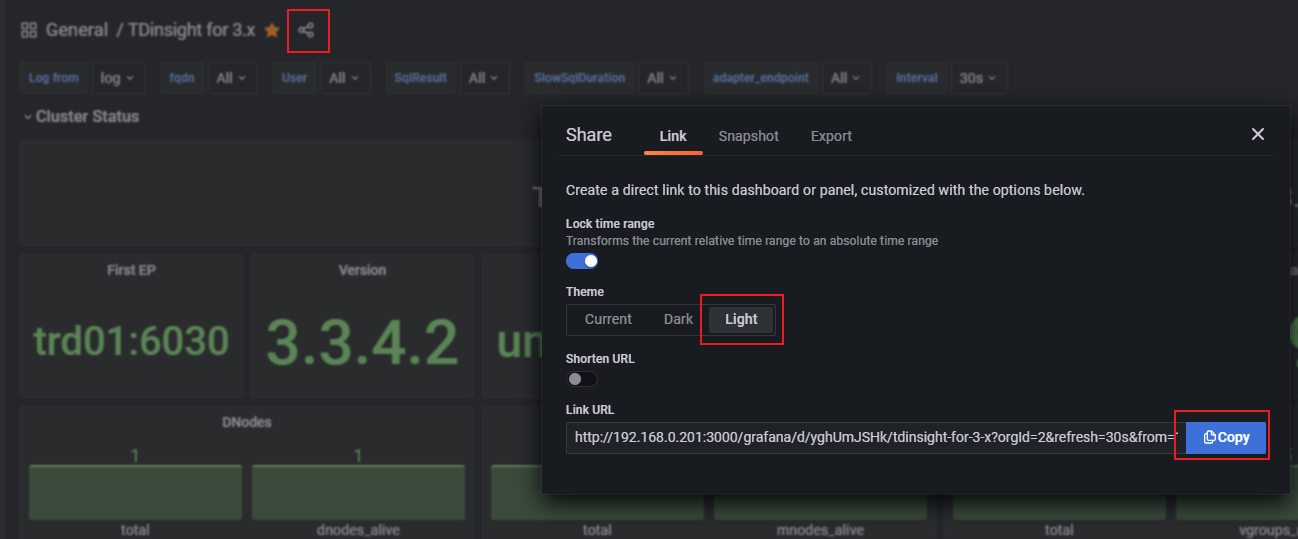
如下图 (grafana V-8.5.27),获取 dashboard url, 获取的 url 请额外加上参数:theme=light&kiosk=tv.
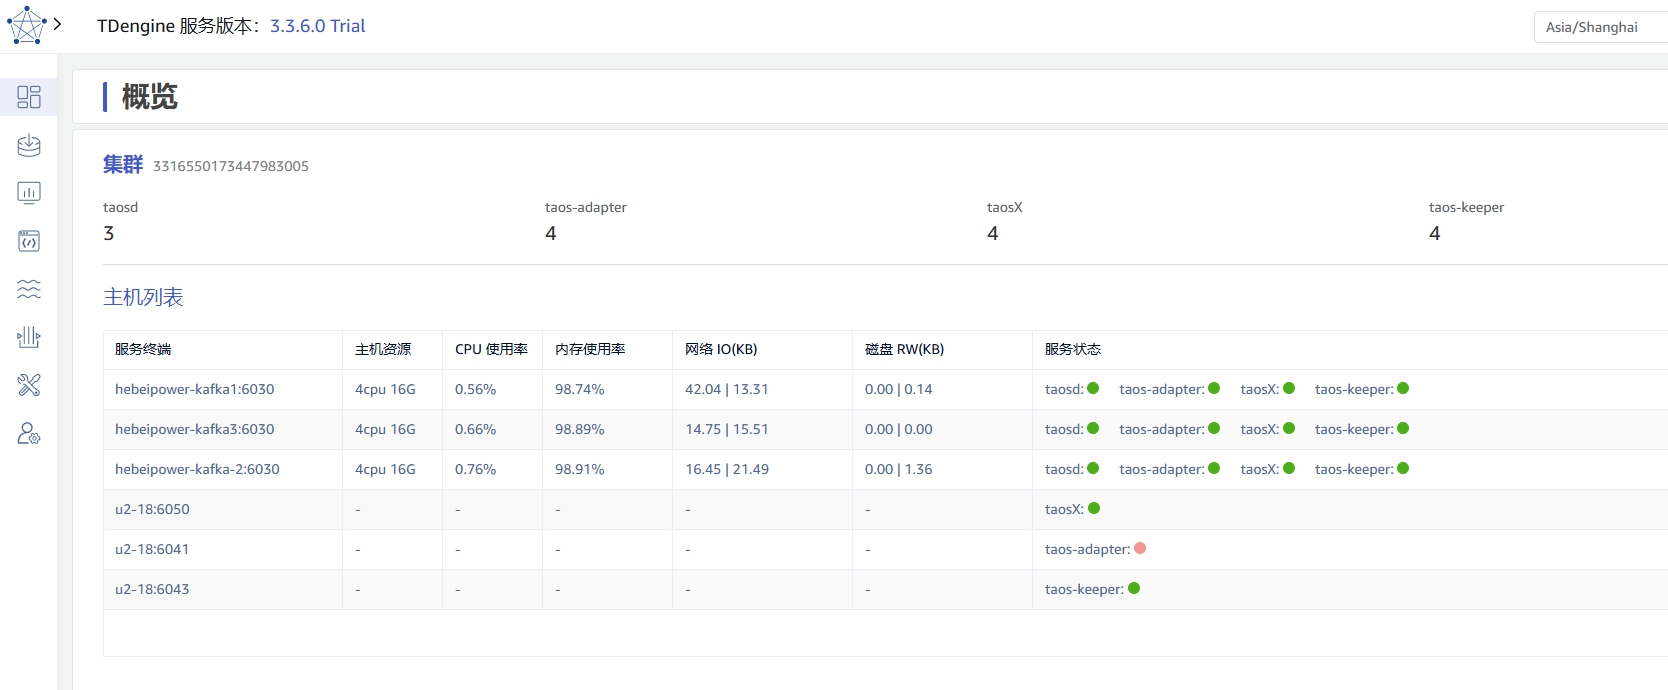
监控集群
登录 explorer 后,切换到“概览”页面,即可查看集群状态。如下图所示,包括集群中 taosd/taos-adapter/taosX/taos-keeper 的服务数量,及 dnode 主机信息和各个服务组件状态。